



Book claims private searches reveal behaviors surveys miss on race and sex

In 60 seconds
- Self-reports on sex, faith, health, and good intentions are warped by the urge to look decent to interviewers and to oneself.
- Anonymous queries line up with clinic records, sales, and public-health data far better than questionnaires do.
- Geographic patterns in racist searches predicted the anti-Obama vote penalty better than racial-attitude surveys.
- Indirect porn and dating traces show same-sex attraction larger and more evenly spread than open-identity surveys admit.
- Parents’ unfiltered searches expose gender bias on kids’ intelligence and looks that they deny when asked.
- Scale without theory yields confident errors, so patterns need A/B tests or natural experiments before anyone acts on them.
The big idea
Shame and self-image make people misreport sensitive acts and beliefs even to anonymous interviewers, so Stephens-Davidowitz treats private digital traces—especially search—as a more honest population signal. That signal still collapses into confident nonsense without theory and causal tests that separate real mechanisms from lucky correlations.
The book in brief
The book opens on a measurement crisis. When researchers ask about condoms, church, abortion, exercise, or plans to vote and diet, the answers describe a better person than independent records support. Social desirability is not a small wording flaw. It is a structural limit of self-report.
That limit drives the turn to unprompted digital behavior. Someone typing a query alone is solving a problem, not managing a reputation. Aggregated search becomes a confession booth at scale. The same method is then pressed against three charged domains: racial animus around the Obama elections, the size and geography of the closet, and the unequal questions parents ask about sons versus daughters.
Google is not the whole instrument. White-nationalist forums, adult-site analytics, dating platforms, and status-update networks each capture different stakes. A message sent on a dating app has consequences a survey answer does not. Combining sources lets each correct the others’ blind spots.
Midway the tone hardens. A celebrated model that estimated flu from search terms worked until media coverage scrambled the old correlations and the estimates broke. Large datasets make impressive noise easy to find. Pattern-matching without a theory of why a term matters is a trap.
The remedy is experimental discipline. Randomly vary a fundraising email or a button and measure what people actually do. Where randomization is impossible, natural experiments—draft lotteries and chance shocks—approximate the same isolation of cause. Big data generates hypotheses; design confirms them.
Handled that way, behavioral trails can surface downturns, abuse risk, or dirty kitchens before official channels. The close is practical: honest residue plus causal checks beats both naive surveys and naive big data.
Context
Published in 2017, the book speaks to marketers, researchers, and data scientists already suspicious of self-report and hungry for a readable case that pairs large-scale digital traces with real causal tests.
The key ideas

1
Surveys paint wishful selves
Direct questions about sensitive acts produce a portrait of who people wish to be, not who they are, because shame filters every answer.
What surveys capture
High reported virtue on church, condoms, and intentions
What records show
Emptier pews, mismatched sales, undercounted procedures
Surveys ask for beliefs and behavior straight up. Straight up is where honesty fails. Reported churchgoing would fill pews that actual headcounts leave sparse. Self-reported condom use refuses to match sales figures.
The gap widens on darker topics. Stigma pushes underreporting even to anonymous interviewers. People also misread their future selves and overstate plans to vote, save, and diet.
Stephens-Davidowitz calls this structural, not a tweakable design quirk. Social desirability contaminates nearly every self-report tool social science trusts. Cleaner wording cannot fix a method that invites performance.
That failure is the reason the rest of the argument exists. If direct questions cannot be trusted, researchers need traces left without an audience.
In practice: General Social Survey church-attendance answers imply far fuller pews than independent headcounts ever find.

2
Search without an audience
Queries typed alone track real abortion rates and other sensitive behaviors more closely than surveys that undercount the practice by roughly half.
½
survey abortion estimates relative to clinic reports
A person at a search box believes, correctly, that no one is watching. Reputation management shuts off. The goal is a problem solved or a curiosity fed.
That change of audience is the mechanism. Aggregated queries, read through public trend tools, act like a confession booth at civilizational scale. Abortion-related search volume follows actual state rates far more tightly than self-reports.
The same tighter alignment appears for sexual interests, drug use, and mental-health symptoms beside public-health data. Shame filters never fully engage because no human is collecting the answer.
The signal is imperfect. People still search for acts they will never perform. Across millions of queries, individual noise washes out and population patterns surface that questionnaires bury.
In practice: State-level abortion search volume hugs clinic-reported rates while survey estimates run about half the real figure.
3
Racism polls cannot catch
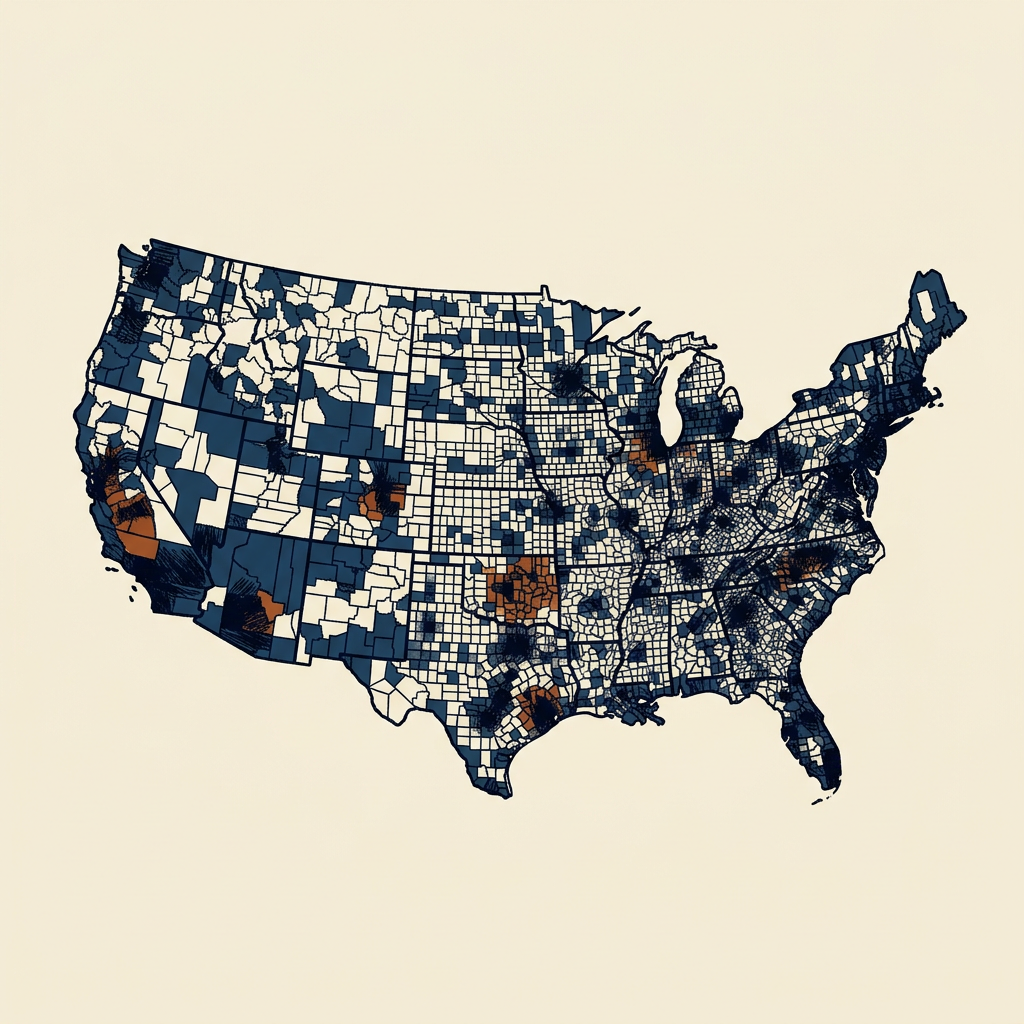
Media-market volume of a specific racist slur predicted Obama’s underperformance versus the Democratic baseline better than survey racial-resentment scores.
Almost no one admits racist views to an interviewer, so attitude surveys stay thin. The substitute measure is the geographic rate of one slur in search logs.
That rate, broken out by media market, is set beside Obama’s 2008 and 2012 vote share relative to earlier Democrats with white candidates. Higher slur-search areas showed a larger anti-Obama penalty after ordinary controls for education and unemployment.
The same map lines up with racially charged hate-crime rates. Ugly spikes also appear on election night in 2008 and around Martin Luther King Day—reactions no poll would record.
Aggregated searches prove nothing about any single person. They do expose a layer of prejudice direct questioning systematically undercounts.
In practice: Slur-search geography beat standard racial-resentment surveys at predicting the Obama vote gap.
4
The closet in proxy data
Porn and personal-ad traces put male same-sex attraction near five percent—roughly double typical surveys—while demand stays flat even where open identity shrinks.
Surveys usually place male homosexuality around two to three percent. Stigma suppresses disclosure even in anonymous polls, so the method turns to indirect residue.
Shares of gay-content searches, Craigslist personals categories, and dating-platform patterns all point higher. The proxy estimate settles near five percent of men.
Geography sharpens the claim. In less tolerant states, openly reported gay populations fall. Gay-content search share barely moves. Demand is stable; willingness to be counted is not. That gap itself measures the closet.
Queries such as whether a husband is gay spike in patterns that track other hidden-relationship markers. These remain proxies with assumptions about identity. The wider point holds: high stigma makes self-report understate reality.
In practice: Gay-content search share stays roughly constant across regions while open identification drops in less tolerant states.

5
Parents’ private double standard
Parents search whether a son is gifted about twice as often as a daughter and fixate far more on daughters’ weight and looks.
Ask parents whether they treat sons and daughters differently and nearly all deny it. Aggregate search data disagrees.
Gifted-son queries run about twice the daughter equivalent even though childhood giftedness rates show no meaningful gender gap. The bias flips for appearance. Daughter-overweight searches swamp the son version even though boys carry somewhat higher obesity rates in health data.
Parents also ask more whether a daughter is ugly and whether a son is a genius. None of this appears on parenting-attitude surveys. Few parents consciously own the expectations, let alone admit them to a researcher.
The searches catch a semi-private moment of worry typed without an evaluator present. Implicit gender bias is not only a lab score. It lives in the ordinary questions people ask about their own kids.
In practice: Daughter-overweight and daughter-ugly searches vastly outnumber the parallel son queries despite boys’ higher obesity rates.

6
More than one platform
Forums, porn analytics, and dating messages each reveal stakes and biases that Google search alone cannot capture.
- GGoogle searchPrivate curiosity and worry
- HHate forumsOrganized ideology in real time
- AAdult-site analyticsSexual interest by place and group
- DDating appsRevealed preference under real stakes
Google records curiosity and private worry. Other platforms record different kinds of honesty.
A white-nationalist forum’s posting volume and content spike around political and cultural triggers, giving a real-time gauge of organized hate no attitude survey could safely collect. Released adult-site analytics break sexual-interest categories down by geography and demographics and extend the closet findings.
Dating platforms add real consequences. Published OkCupid analysis by Christian Rudder shows systematic racial gaps in how users rate and message other races—gaps people would never state in an interview about their preferences. Facebook aggregates have let outside researchers watch political sentiment and emotional contagion move through friend networks.
No single source is universal. Combining them lets each correct the others’ blind spots and triangulate hidden attitudes more honestly.
In practice: Dating-app users display racial messaging disparities they would never claim when asked about their own preferences.

7
When pattern-matching breaks
Google Flu Trends roughly doubled true peak flu once media-driven searches decoupled from illness, proving scale without theory yields confident nonsense.
Early Flu Trends
Search volume tracked incidence and beat reporting lag
2012–2013 break
Estimates ran about double actual peak after media-driven queries
For years the model used flu-related query volume to estimate prevalence faster than official reporting. It looked like big data beating traditional epidemiology.
Then the 2012–2013 season hit. Estimates ran about double actual peak prevalence. David Lazer and colleagues dissected the failure in a 2014 Science paper and named the disease big data hubris.
The model had ridden correlations without a theory of why particular terms mattered. When news coverage itself sent healthy people searching, the algorithm had no anchor. Overfitting thrives when variables and rows multiply; larger data makes impressive noise easier to find.
The collapse brakes the book’s own enthusiasm. Dataset size is not a substitute for domain knowledge or skepticism about why a pattern exists.
In practice: Media coverage of flu drove searches unrelated to sickness and broke a model that had looked unstoppable.

8
Experiments beat hunches
Massive data generate hypotheses; only randomized A/B tests or natural experiments confirm that a pattern is causal rather than coincidence.
- 1Spot a patternUse large behavioral data to form a hypothesis
- 2RandomizeAssign people to variants by chance
- 3Measure real behaviorCompare actions, not self-report
- 4Keep or killShip only what the test supports
Correlation alone cannot guide decisions. The fix is deliberate design.
A/B testing randomly shows different webpage, email, or button versions and measures real outcomes. Obama’s 2012 campaign tested fundraising subject lines and donation-page wording. Unglamorous personal phrasing substantially beat polished alternatives—a result no correlational search study could have delivered because the variable had to be manipulated.
Large tech firms run thousands of such tests at once, treating product choices as hypotheses. Where true randomization is impossible, natural experiments help. Draft lotteries have let economists study how military service or extra schooling changes lifetime earnings because lottery numbers are arbitrary.
Big data and causal inference are partners. Scale spots patterns worth testing. Only experiment or quasi-experiment shows a mechanism rather than a shared cause or fluke.
In practice: Obama 2012 fundraising tests found plain personal subject lines raised more money than slicker copy.

9
Trails before official stats
Validated behavioral residue can flag local downturns, abuse risk, and dirty restaurants earlier than government figures or inspectors.
Once theory and tests are in place, the practical payoff appears. Private behavior often shifts before official channels record the event.
Leisure-related and pornography search volume can rise in regions shortly before unemployment figures confirm a downturn. Economic anxiety shows up in what people quietly do online faster than bureaucracies compile numbers.
Other work links certain search and image patterns to places and seasons—holiday periods among them—where child-welfare hotlines later see more abuse reports, raising the chance of earlier intervention if the right institutions use the signals responsibly. Review-site complaint language has flagged restaurants likely to fail health inspections before inspectors arrive.
Sports analytics supplies an older proof of concept: undervalued statistical predictors of performance, now extended by digital data into betting and roster calls. Behavior leaves a trail first. Read carefully and validate against known outcomes, and it becomes an early warning.
In practice: Yelp complaint wording has predicted health-inspection failures before official visits.
Key terms
- Social desirability bias The habit of giving answers that make you look good instead of answers that are true.
- Digital confession booth Anonymous search and click data treated as a more honest record because no audience is watching.
- Big data hubris Trusting huge correlational models without a theory of why the patterns exist.
- Overfitting Finding striking statistical links that are really noise because too many variables were searched.
- A/B test A live experiment that randomly shows different versions and measures which one changes real behavior.
- Natural experiment A real-world chance assignment—like a draft lottery—that isolates cause when you cannot randomize yourself.
- Triangulation Combining imperfect sources so search, forums, porn analytics, and dating logs correct one another’s blind spots.
What to do
- Swap face-value survey scores for behavioral traces people leave without an audience—usage logs, searches, purchases.
- Before acting on any striking pattern, write a theory for why it exists, not just a statistical link.
- Run one real A/B test this week on an email subject, web line, or price instead of shipping a hunch.
- List the sensitive questions your team still asks customers or staff directly and mark which ones invite performance.
- When a dashboard correlation looks too clean, write what would falsify it before you trust it.
Questions to think with
- Which of your current surveys mostly measure how people want to be seen?
- What private digital traces already sit in your work while you still lean on self-report?
- When does a vivid big-data pattern still fail the Flu Trends test?
- How would you validate an early-warning signal without turning it into unchecked surveillance?
- Where might your own hiring, parenting, or dating choices leave a trail that contradicts what you would say aloud?
The other side
The diagnosis of survey failure is strong; the boldest positive claims—racist searches and the Obama gap, porn-based closet size, leisure searches ahead of recessions—often rest on the same correlational style the Flu Trends chapter tells readers to distrust. Google’s user base is treated as roughly everyone despite age, income, and access skews never fully corrected. Some headline estimates lack the peer-reviewed replication the Lazer critique received, and the celebration of intimate data barely grapples with surveillance, manipulation, or discriminatory algorithms that Cathy O’Neil mapped the same year.
Who it's for
Marketers and researchers who need a rigorous substitute for self-report, plus curious readers and working data scientists who want large-scale digital traces paired with real causal tests rather than another hymn to big data alone.