




Bubbles run on stories until new buyers run out
Prices can triple while earnings crawl because attention, narrative, and ordinary shortcuts feed one another.
IJR · Nov 5, 2026 · 14 min read
In 60 seconds
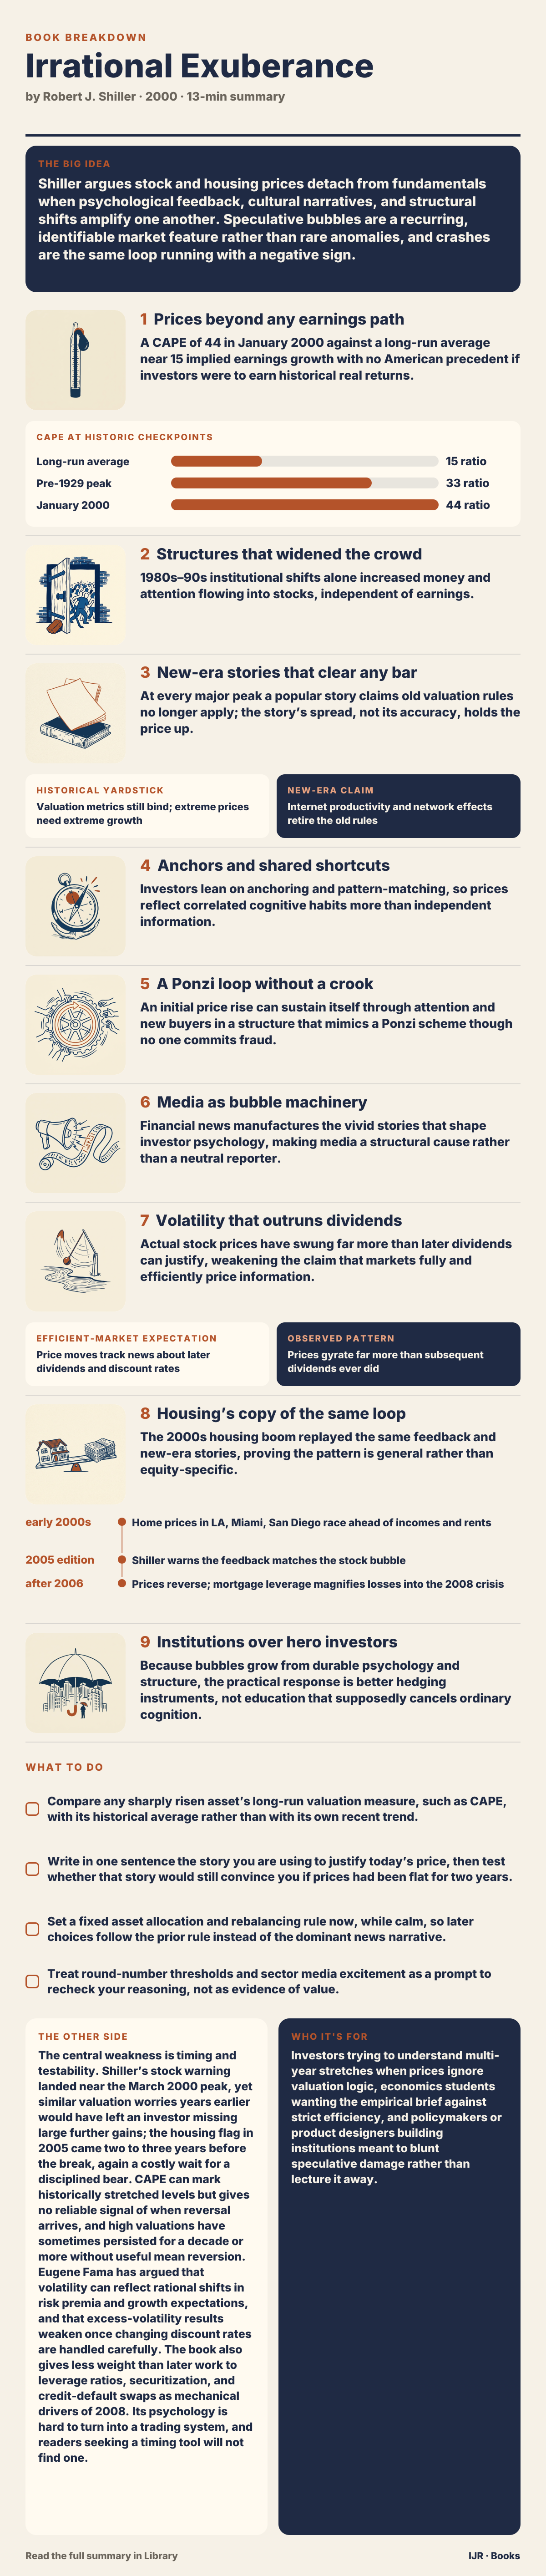
- In January 2000 the CAPE ratio hit 44 against a long-run average near 15, a gap Shiller says no historically plausible earnings path can close.
- 1980s–90s shifts—401(k)s, discount brokers, exploding mutual funds, and round-the-clock financial TV—pulled ordinary households into stocks and raised the volume of attention on prices.
- Every major peak rides a persuasive 'new era' story that old valuation rules no longer apply; popularity, not accuracy, keeps the story alive.
- Rising prices trigger a naturally occurring Ponzi-like loop: attention draws buyers, buyers lift prices, prices confirm the story until fresh money cannot keep pace.
- The identical feedback and narratives reappeared in 2000s housing, where prices outran incomes and rents and leverage later amplified the reversal.
- Because the psychology is durable, Shiller favors new hedging institutions over hoping education will make individuals immune.
The big idea
Shiller argues stock and housing prices detach from fundamentals when psychological feedback, cultural narratives, and structural shifts amplify one another. Speculative bubbles are a recurring, identifiable market feature rather than rare anomalies, and crashes are the same loop running with a negative sign.
The book in brief
The book opens by showing that extreme market levels cannot be read as the efficient pricing of known information. When prices pull far ahead of any earnings path history supports, the explanation must sit elsewhere: in attention, stories, and self-reinforcing buying.
It then catalogs institutional changes that widened participation and public focus on markets. None of those shifts required irrationality on their own; together they enlarged the pool of capital and the intensity of watching prices move.
From there the argument turns cultural and cognitive. Peak moments produce narratives claiming the old rules are obsolete. Investors lean on anchors, pattern-matching, and overconfidence rather than independent valuation, so shared shortcuts aggregate into collective mispricing.
The mechanical core is a feedback process that behaves like a Ponzi scheme without a con artist: an initial rise generates stories and buyers, which push prices higher and validate the stories, until new money runs short and the loop reverses. Financial media is treated as an active amplifier of the vivid plots that sustain the cycle.
Empirical work on excess price volatility relative to later dividends underpins the claim that markets are not fully efficient in the strong sense. The same framework is then applied to housing in the 2000s, where prices diverged from incomes and rents under a parallel new-era story and debt magnified the damage when prices fell.
The close shifts from diagnosis to design. Because bubbles grow from durable features of cognition and structure, Shiller pushes for instruments and institutions that let households hedge broad risks rather than for education alone to override ordinary psychology.
Context
Shiller published the first edition in March 2000, within days of the Nasdaq and S&P 500 peaks, which gave the valuation warning unusual accidental force. Later editions extended the same analysis to the housing boom of the 2000s, drawing on the Case-Shiller Home Price Index he co-developed. In 2013 he shared the Nobel with Eugene Fama, the prize committee treating their debate on market efficiency as still unresolved.
The key ideas

1
Prices beyond any earnings path
A CAPE of 44 in January 2000 against a long-run average near 15 implied earnings growth with no American precedent if investors were to earn historical real returns.
CAPE at historic checkpoints
Shiller anchors the opening case on the cyclically adjusted price-earnings ratio: the S&P 500 price divided by the average of the prior ten years of inflation-adjusted earnings, with data running back to 1881. The long-run average sits near 15. In January 2000 the ratio reached 44, higher even than the peak of 33 just before the 1929 crash.
At that level, stockholders could earn anything like the historical long-run real return of six to seven percent only if corporate earnings grew at a pace never sustained in U.S. history. No reasonable discount rate or dividend-growth assumption closed the gap. Between 1996 and 2000 the S&P 500 roughly tripled while earnings rose far more modestly.
The claim is not that the exact top is knowable. It is that levels this extreme cannot be treated as the market efficiently pricing known information. Attention, narrative, and self-reinforcing buying have to be doing part of the work.
In practice: The January 2000 CAPE of 44 exceeded the pre-1929 reading of 33 and sat nearly three times the long-run average near 15.

2
Structures that widened the crowd
1980s–90s institutional shifts alone increased money and attention flowing into stocks, independent of earnings.
Shiller lists precipitating factors that raised both capital supply and the number of people watching prices. The move from defined-benefit pensions to defined-contribution 401(k) plans put retirement choices into the hands of millions who had never picked stocks themselves.
Discount brokerages cut trading costs and opened frequent buying to individuals. The mutual-fund industry grew from a few hundred funds in the early 1980s to several thousand by the late 1990s, each marketing new money into equities. Cable financial news, with CNBC’s 1989 launch and later round-the-clock coverage, turned the market into entertainment tracked like sports scores.
None of these moves required irrationality. Each answered a real need—cheaper trades, more retirement choice, more information. Together they enlarged the pool of less experienced participants watching prices constantly, a structure more prone to herding than one dominated by a few professional allocators.
In practice: CNBC’s launch in 1989 and the mutual-fund explosion of the 1980s–90s turned price watching into a mass daily habit.

3
New-era stories that clear any bar
At every major peak a popular story claims old valuation rules no longer apply; the story’s spread, not its accuracy, holds the price up.
Historical yardstick
Valuation metrics still bind; extreme prices need extreme growth
New-era claim
Internet productivity and network effects retire the old rules
Shiller traces a repeating cultural pattern. When speculation peaks, a persuasive narrative explains why traditional metrics are obsolete. In the late 1990s the story was that the internet had created a genuinely new economy of productivity gains, network effects, and disintermediation that justified valuations absurd by historical standards.
The 1999 book Dow 36,000 argued stocks were undervalued and should trade several times higher because equities had finally been recognized as no riskier than bonds over the long run. The same phrase “new era” had described the 1920s market just before 1929, and similar reasoning has attended real-estate and other peaks earlier still.
These stories work because they are plausible enough for intelligent people to take seriously, and because believing them feels better—and pays better in the short run—than doubting them. Holders of rich prices have a strong incentive to find and repeat a justifying story. Rising prices create demand for the story; the story draws more buyers; higher prices make the story feel truer.
In practice: Dow 36,000 claimed late-1990s stocks were cheap once investors accepted equities as bond-like safe over long horizons.

4
Anchors and shared shortcuts
Investors lean on anchoring and pattern-matching, so prices reflect correlated cognitive habits more than independent information.
Drawing on Tversky and Kahneman, Shiller applies anchoring to price expectations. People rarely compute intrinsic value from first principles; they lock onto a recent price or a round number and adjust too little from it. Thresholds such as Dow 10,000 or 11,000 draw media and commentary simply because they are round, not because they carry economic meaning.
The representativeness heuristic leads investors to treat a multi-year tech rally as the expected pattern and to discount reversal, even though long stretches of above-average returns have often been followed by below-average ones. Overconfidence compounds the problem: surveys and experiments show people rate their own investing skill as better than average, a population-level impossibility that fuels excess trading and thin hedging.
None of this requires foolishness. These are ordinary features of cognition under uncertainty. When large numbers share the same anchors and the same pattern instincts, individually reasonable shortcuts become collective mispricing because the shortcuts are correlated rather than independent.
In practice: Round milestones like Dow 10,000 became media events and psychological magnets with no underlying economic content.

5
A Ponzi loop without a crook
An initial price rise can sustain itself through attention and new buyers in a structure that mimics a Ponzi scheme though no one commits fraud.
This is the book’s mechanical center. Shiller describes a naturally occurring Ponzi process: any initial increase draws attention and enthusiastic stories. The stories pull in new buyers, whose purchases lift the price further, generating more enthusiasm and converting sidelined skeptics.
Unlike a fraudulent scheme, no operator runs the process and no one need realize early investors are effectively paid by later ones. The mechanism runs on successive investors reading rising prices as proof of an underlying truth when the rise is the process itself. That is why bubbles can last far longer than a single overvaluation should: each new cohort’s capital temporarily validates the last cohort’s decision.
The process has a hard limit. It needs continually accelerating new money, and eventually the supply of buyers cannot support the price required to reward existing holders. Then the same loop runs backward: falling prices breed pessimistic stories, selling confirms the pessimism, and the reversal is often sharp rather than gentle. Crashes are not a separate phenomenon; they are the feedback structure with a negative sign.
In practice: Each wave of new buyers temporarily validates the prior wave until recruitment can no longer keep up with the required price.

6
Media as bubble machinery
Financial news manufactures the vivid stories that shape investor psychology, making media a structural cause rather than a neutral reporter.
Shiller treats the financial press as a participant in market dynamics. Journalists need copy that attracts audiences; a dramatic arc about one company’s rise or a sweeping new-economy claim outsells careful talk of valuation uncertainty.
Round-the-clock financial television created continuous demand for fresh, attention-grabbing material, which encouraged amplification of individual stock dramas and star-analyst pronouncements. Coverage does more than mirror sentiment: it helps create it by giving particular names and narratives visibility out of proportion to their economic weight.
Coverage of a theme also tends to swell after prices have already moved, so media often adds fuel to a fire started elsewhere. Still, the amplification matters because it widens the pool of people who notice and enter the trend. More media capacity plus more retail participation produced an information environment that could reach far more potential buyers than in earlier market eras.
In practice: CNBC-style continuous coverage turned single internet names and analyst calls into disproportionate public spectacles.

7
Volatility that outruns dividends
Actual stock prices have swung far more than later dividends can justify, weakening the claim that markets fully and efficiently price information.
Efficient-market expectation
Price moves track news about later dividends and discount rates
Observed pattern
Prices gyrate far more than subsequent dividends ever did
Shiller roots the behavioral case in earlier academic work, especially a 1981 study comparing the volatility of real stock prices with the volatility implied if prices were only the present value of subsequent dividends discounted at a constant rate. Prices moved far more than dividends ever did—a result hard to square with the efficient-market view then dominant and one that drew sharp pushback from rational-expectations economists.
He sets this against Burton Malkiel’s random-walk claim that price changes are unpredictable precisely because information is incorporated at once. Shiller does not promise easy short-run forecasts. He does argue that valuation ratios such as CAPE have historically tended toward long-run mean reversion: very high ratios have been followed, over roughly ten-year horizons, by below-average returns, and very low ratios by above-average ones.
That is a probabilistic, statistical claim, not a timing switch. Mean reversion can take many years, and a high ratio can climb higher still. Behavioral finance here is offered as an alternative empirical account that, in Shiller’s view, fits the historical record better than full efficiency.
In practice: The 1981 comparison found price swings far larger than the dividend streams those prices were supposed to discount.

8
Housing’s copy of the same loop
The 2000s housing boom replayed the same feedback and new-era stories, proving the pattern is general rather than equity-specific.
- early 2000sHome prices in LA, Miami, San Diego race ahead of incomes and rents
- 2005 editionShiller warns the feedback matches the stock bubble
- after 2006Prices reverse; mortgage leverage magnifies losses into the 2008 crisis
In post-2000 editions Shiller turns the framework on real estate, using the Case-Shiller Home Price Index he co-developed. Repeat-sales data track the same houses over time instead of median prices distorted by the mix of homes sold. In cities such as Los Angeles, Miami, and San Diego, prices in the early 2000s rose far faster than incomes or rents—the housing analogue of the earlier earnings gap in stocks.
The accompanying story held that land was permanently scarce, population growth guaranteed rising demand, and financial innovation—looser lending and subprime mortgages—had safely widened homeownership without systemic risk. Shiller warned by the 2005 edition that the structure matched the stock episode: rising prices drew media and speculative buyers, which lifted prices further and confirmed the narrative.
One difference mattered. Housing is tightly tied to household leverage because most purchases are mortgaged. When prices reversed after 2006, losses were amplified by debt in a way the 2000 equity decline was not, feeding the severity of the 2008 crisis that followed.
In practice: By 2005 Shiller flagged U.S. housing cities where prices had outrun incomes and rents under a scarcity-and-innovation story.

9
Institutions over hero investors
Because bubbles grow from durable psychology and structure, the practical response is better hedging instruments, not education that supposedly cancels ordinary cognition.
Shiller closes with proposals aimed at limiting damage rather than eliminating bubbles. Individuals cannot be counted on to spot and avoid bubbles in real time; even sophisticated observers disagree about when a price is unjustified. Policy should therefore build infrastructure that lets people hedge large economic risks they cannot otherwise diversify.
He proposes macro markets: tradable claims tied to broad indicators such as national income, occupational income, or regional real-estate values. A homeowner could then hedge a drop in local property values much as currency risk is hedged today. He also pushes broader democratization of risk-management tools long limited to big institutions, on the ground that concentrated bets on one house or one employer’s stock are a major source of harm when bubbles burst.
He is candid that the ideas need heavy institutional innovation and have been slow to appear; GDP-linked bonds and kin remain niche decades later. The larger claim is that product and regulatory design beat attempts to make every investor psychologically immune, because the pressures described earlier sit in ordinary cognition that schooling alone does not reliably override.
In practice: Macro markets would let a homeowner hedge local real-estate decline the way one hedges currency exposure today.
Key terms
- CAPE Cyclically adjusted price-earnings ratio: S&P 500 price divided by the average of ten years of inflation-adjusted earnings.
- Precipitating factors Institutional shifts—401(k)s, discount brokers, fund growth, financial TV—that enlarge capital and attention without anyone needing to be irrational.
- New-era story A popular narrative at a peak claiming old valuation rules no longer apply; its spread, not its truth, helps hold prices up.
- Anchoring The habit of locking onto a recent price or round number and adjusting too little from it when forming expectations.
- Naturally occurring Ponzi process A self-feeding rise in which attention and new buyers push prices higher and seem to confirm the story, with no fraudster in charge.
- Excess volatility The finding that stock prices have moved far more than later dividends can justify under constant discount rates.
- Macro markets Proposed exchange-traded claims on broad economic measures so households can hedge income or local housing risk.
- Mean reversion of CAPE The historical tendency for very high valuation ratios to be followed, over long horizons, by below-average returns.
What to do
- Compare any sharply risen asset’s long-run valuation measure, such as CAPE, with its historical average rather than with its own recent trend.
- Write in one sentence the story you are using to justify today’s price, then test whether that story would still convince you if prices had been flat for two years.
- Set a fixed asset allocation and rebalancing rule now, while calm, so later choices follow the prior rule instead of the dominant news narrative.
- Treat round-number thresholds and sector media excitement as a prompt to recheck your reasoning, not as evidence of value.
Questions to think with
- What single story is currently doing the most work justifying the asset you hold most of?
- If new buyers stopped arriving for a year, which part of your thesis would still stand on earnings or rents alone?
- Where in your portfolio is leverage quietly amplifying a narrative you have not stress-tested?
- Which institutional hedge—if it existed—would most reduce damage from a reversal in your home equity or job income?
- How would you tell a durable productivity shift from a new-era story that only feels true because prices already rose?
The other side
The central weakness is timing and testability. Shiller’s stock warning landed near the March 2000 peak, yet similar valuation worries years earlier would have left an investor missing large further gains; the housing flag in 2005 came two to three years before the break, again a costly wait for a disciplined bear. CAPE can mark historically stretched levels but gives no reliable signal of when reversal arrives, and high valuations have sometimes persisted for a decade or more without useful mean reversion. Eugene Fama has argued that volatility can reflect rational shifts in risk premia and growth expectations, and that excess-volatility results weaken once changing discount rates are handled carefully. The book also gives less weight than later work to leverage ratios, securitization, and credit-default swaps as mechanical drivers of 2008. Its psychology is hard to turn into a trading system, and readers seeking a timing tool will not find one.
Who it's for
Investors trying to understand multi-year stretches when prices ignore valuation logic, economics students wanting the empirical brief against strict efficiency, and policymakers or product designers building institutions meant to blunt speculative damage rather than lecture it away.