




How statistics stops noisy data from fooling you
Readers who face polls, drug claims, and workplace metrics and want the logic under the formulas, not another class.
IJR · Nov 5, 2026 · 14 min read
In 60 seconds
- Wheelan treats statistics as description plus inference: compress data, then let a sample speak for a population too large to measure.
- A true average can still mislead because it hides the distribution, outliers, and whether the mean was even the right summary.
- Conditional probability explains why a highly accurate test for a rare disease still yields mostly false positives.
- Confidence intervals and p-values admit uncertainty; they do not prove a finding is large, important, or causal.
- Regression can isolate one factor while holding others constant, yet omitted variables and reverse causation still corrupt the story.
- Big data and selective graphs repeat classic errors at scale, so asking about sample, baseline, and confounders is civic self-defense.
The big idea
Wheelan argues that statistics is a handful of thinking tools for pulling signal from noise, not a wall of formulas, and that those intuitions matter more for citizens than memorizing calculations. Grasped, they let ordinary readers see through bad headlines and policy claims; misread, the same tools become instruments of deception.
The book in brief
Wheelan opens by separating statistics from math anxiety. The real job, he says, is description and inference: turn a mass of numbers into something comprehensible, then use a measured sample to make a reliable claim about a population no one can observe whole. Formulas are only vocabulary for that bridge. A school district judging a reading program cannot test every child in the country; it compares samples and needs language for whether the gap is real or noise. Readers who grasp representativeness, sample size, and the difference between correlation and causation already hold most of what matters.
He next shows what compression costs. Means, medians, and modes tell different stories about the same set, and a single polished number can flatter a claim while hiding the shape underneath. Inference later in the book rests on these descriptive foundations; misdescribe the distribution and every later claim inherits the error.
Probability then becomes the backbone. Independent events, conditional probability, and the multiplication rule are not parlor tricks; they decide gambling odds, medical screening, and courtroom evidence. Intuition fails here so often that professionals routinely misstate the chance a result is a fluke.
The normal curve and the central limit theorem supply the hinge to formal inference. Many phenomena cluster in a predictable bell, and even messy data yields well-behaved sample averages as samples grow. That footing lets Wheelan walk through confidence intervals on election polls, the honesty and limits of margins of error, and the logic of hypothesis tests and p-values—tools that say whether chance alone could produce a result, not whether the result is large or worth caring about.
Regression arrives as the workhorse that quantifies one relationship while holding others constant, a clear advance over raw correlation, yet still unable to prove cause or invent controls never collected. Later chapters apply the same toolkit to big data, credit scores, and search algorithms, then to the ethics of presentation: the same true figures can be framed to support opposite conclusions. The book lands on a defensive claim. Statistical literacy is how voters, jurors, and consumers hold data-driven claims accountable.
Context
Charles Wheelan published the book in 2013 as a conceptual primer for people who passed a stats class without ever knowing what the formulas were for, and for professionals and curious readers who wanted to judge polls, trials, and data reports critically rather than calculate them.
The key ideas

1
Tools not arithmetic
Statistics matters as a disciplined way to extract signal from noise; treating it as mere calculation is what breeds fear and misuse.
Math anxiety view
Statistics equals formulas to memorize and fear
Wheelan's view
Statistics equals tools to pull signal from noise and judge claims
Wheelan separates the subject from math anxiety at the outset. Description compresses a pile of observations into something a mind can hold. Inference then lets a sample stand in for a population no census or trial can fully reach.
A drug trial cannot dose every patient on earth. A bureau cannot interview every citizen. The bridge between the group actually measured and the larger claim is built from means, spreads, and probabilities—vocabulary, not the destination.
Formulas stay secondary to intuition. Anyone who already sees why a sample must be representative, why bigger samples cut error, and why correlation is not causation understands the load-bearing ideas before touching a calculator.
That framing runs the rest of the book. Each later tool is another intuition that, when botched, yields bad headlines and bad policy, and when held, lets an ordinary reader see through them.
In practice: A school district judges a new reading program by comparing a sample that used it against a sample that did not, then uses statistical language to decide whether the difference is real or noise.

2
The misleading average
A single summary number can be technically accurate and still mislead because it hides the shape of the distribution behind it.
Mean story
One extreme value pulls the average up and flatters the whole group
Median story
The middle value stays put and shows what a typical person actually has
Compression always loses something. Mean, median, and mode each narrate the same data differently, and picking one can flatter or distort.
Income makes the trap concrete. One extreme high value drags the mean upward so a place looks prosperous while the typical resident struggles. That is why many economists reach for the median on wealth and pay: it resists outliers the mean cannot.
Spread matters as much as center. Two groups can share an identical average while one sits tightly clustered and the other splits between failure and perfection; the average alone cannot tell them apart. Standard deviation is the plain measure of that scatter.
Any reported figure therefore invites a follow-up: what does the distribution look like, and was the average even the right summary? Get description wrong and every inference built on it inherits the flaw.
In practice: Average income in a small town rises sharply because one billionaire lives there, while the median resident is still struggling.
3
Probability's hidden traps
Misreading basic probability, especially conditional probability, drives bad decisions from casinos to medical screening to court.
99%
accurate test that can still yield mostly false positives when the disease is rare
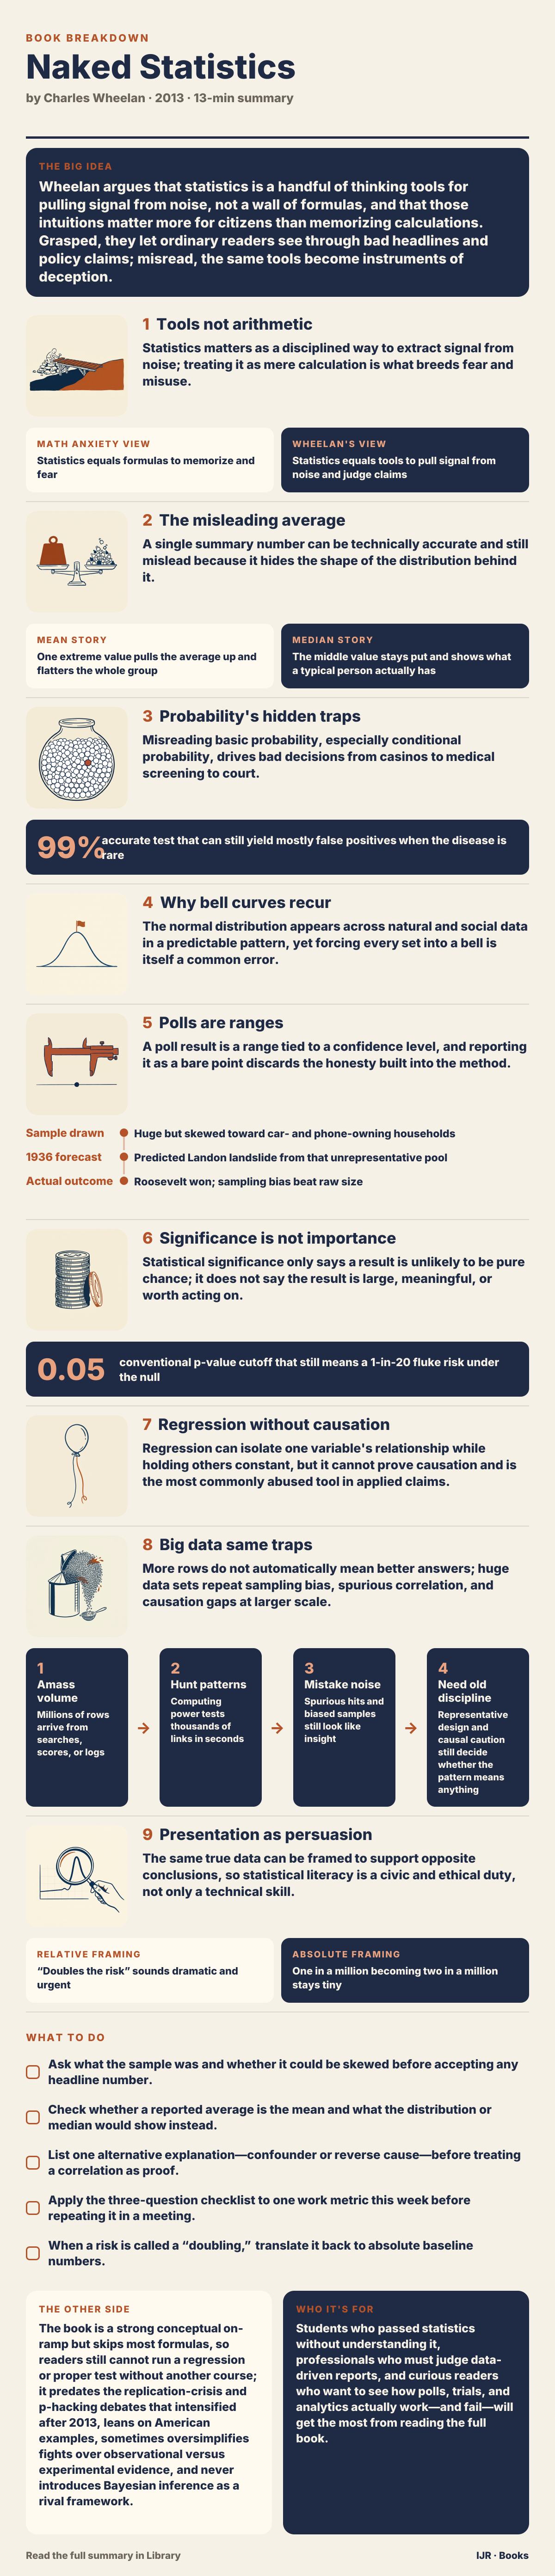
Nearly every later statistical claim rests on probability, so Wheelan treats it as required machinery rather than optional color. Independent events, conditional probability, and the multiplication rule are the working parts.
Casinos profit from intuition failing even simple independence. The gambler's fallacy—the sense that a coin is “due” after a run of heads—shows how quickly gut feel parts company with the rule.
Stakes rise with medical testing. When a condition is rare, the pool of healthy people is enormous, so even a low error rate still generates a flood of false alarms relative to true hits. The same structure makes mass screening for vanishingly rare threats statistically inefficient: false positives swamp real catches.
Doctors, judges, and juries misfire on these problems in ways that produce unnecessary procedures and misstated courtroom odds. A reader who skips this logic will later misread every significance claim that depends on it.
In practice: A test for a rare disease can be 99 percent accurate and still produce mostly false positives, because healthy people so outnumber the sick.
4
Why bell curves recur
The normal distribution appears across natural and social data in a predictable pattern, yet forcing every set into a bell is itself a common error.
After probability, Wheelan turns to the familiar bell-shaped curve. Height, IQ scores, and measurement errors often cluster symmetrically around a mean, with standard deviation setting the tightness.
The empirical rule gives the pattern practical bite: most observations fall near the center, and the share drops fast as you move farther out. That is why a standardized test score means something only relative to everyone else's scores.
Limits matter as much as power. Income is skewed, with a long high tail; slap bell-curve assumptions on it and conclusions turn to nonsense. Not every data set is normal, and defaulting to the curve is a quiet statistical mistake.
The central limit theorem supplies the surprise that rescues practice. Even when individual points are messy, averages of repeated samples drift toward a normal shape as sample size grows. Polling and quality control depend on that fact: sample averages can stand in for population truths when the underlying data will not.
In practice: SAT-style scores become interpretable only because each result is placed inside the bell of everyone else's results, using the spread around the mean.

5
Polls are ranges
A poll result is a range tied to a confidence level, and reporting it as a bare point discards the honesty built into the method.
- Sample drawnHuge but skewed toward car- and phone-owning households
- 1936 forecastPredicted Landon landslide from that unrepresentative pool
- Actual outcomeRoosevelt won; sampling bias beat raw size
The central limit theorem now connects to something readers see constantly: election surveys. A candidate's share arrives with a margin of error because the method admits sampling uncertainty up front.
Larger samples shrink that margin, yet with diminishing returns that follow a square-root pattern rather than a straight line. That is why national polls often plateau near a thousand respondents instead of chasing tens of thousands.
Margin of error only covers sampling error. It is silent about a badly worded question or a sample that misses whole groups. Those other distortions can sink a finding even when the arithmetic looks tidy.
Good practice therefore communicates a range and a confidence level, not a fake exact count. Media habits that strip the range away throw away the most honest part of the result and set up the next chapter's hypothesis tests, which rest on the same probabilistic humility.
In practice: The 1936 Literary Digest poll forecast a Landon landslide over Roosevelt from a huge sample skewed toward wealthier households that owned cars and phones.

6
Significance is not importance
Statistical significance only says a result is unlikely to be pure chance; it does not say the result is large, meaningful, or worth acting on.
0.05
conventional p-value cutoff that still means a 1-in-20 fluke risk under the null
Hypothesis testing sits behind headlines that announce a “statistically significant” effect. The null hypothesis is the boring default—no real effect. The p-value is the chance of seeing a result at least as extreme if that default were true.
Cross a conventional threshold and researchers reject the null. Wheelan is blunt that the common cutoff is a habit, not a law of nature, and still leaves a real chance the finding is a fluke. Run many independent tests and some will clear the bar by accident alone; isolated surprises about food and cancer or genes and personality deserve skepticism until they replicate.
Size of sample warps the story further. A trivial effect can clear the significance bar in a huge study, while a genuinely important effect in a small study can miss it. A drug that nudges blood pressure by a clinically useless amount can still look “significant” in a vast trial.
The same trap reappears inside regression coefficients later: a technically significant number is not automatically a practically important one.
In practice: If you run twenty independent tests, on average one will look significant purely by chance, which is why unreplicated surprise findings need a second look.

7
Regression without causation
Regression can isolate one variable's relationship while holding others constant, but it cannot prove causation and is the most commonly abused tool in applied claims.
Regression is the workhorse of applied social science because it handles several explanatory factors at once. The coefficient on education, for instance, can reflect the link to income after statistically holding parental income, region, and gender steady—an advance over a raw two-variable correlation.
What it cannot do is invent data never collected. Leave out a real driver and omitted-variable bias can warp every estimate. The model only conditions on what you actually measured.
Classic confounds make the gap vivid. Ice cream sales and drowning deaths rise together because summer heat drives both, not because one causes the other. Reverse causation muddies other pairs: healthier people may simply be more able to exercise, so the arrow between fitness and health can point either way.
Wheelan's practical payoff is a reading checklist for any regression-based news claim: which variables were controlled, what might be missing, and whether cause was shown or merely assumed.
In practice: Ice cream sales and drowning deaths correlate because summer heat drives both, not because ice cream causes drowning.
8
Big data same traps
More rows do not automatically mean better answers; huge data sets repeat sampling bias, spurious correlation, and causation gaps at larger scale.
- 1Amass volumeMillions of rows arrive from searches, scores, or logs
- 2Hunt patternsComputing power tests thousands of links in seconds
- 3Mistake noiseSpurious hits and biased samples still look like insight
- 4Need old disciplineRepresentative design and causal caution still decide whether the pattern means anything
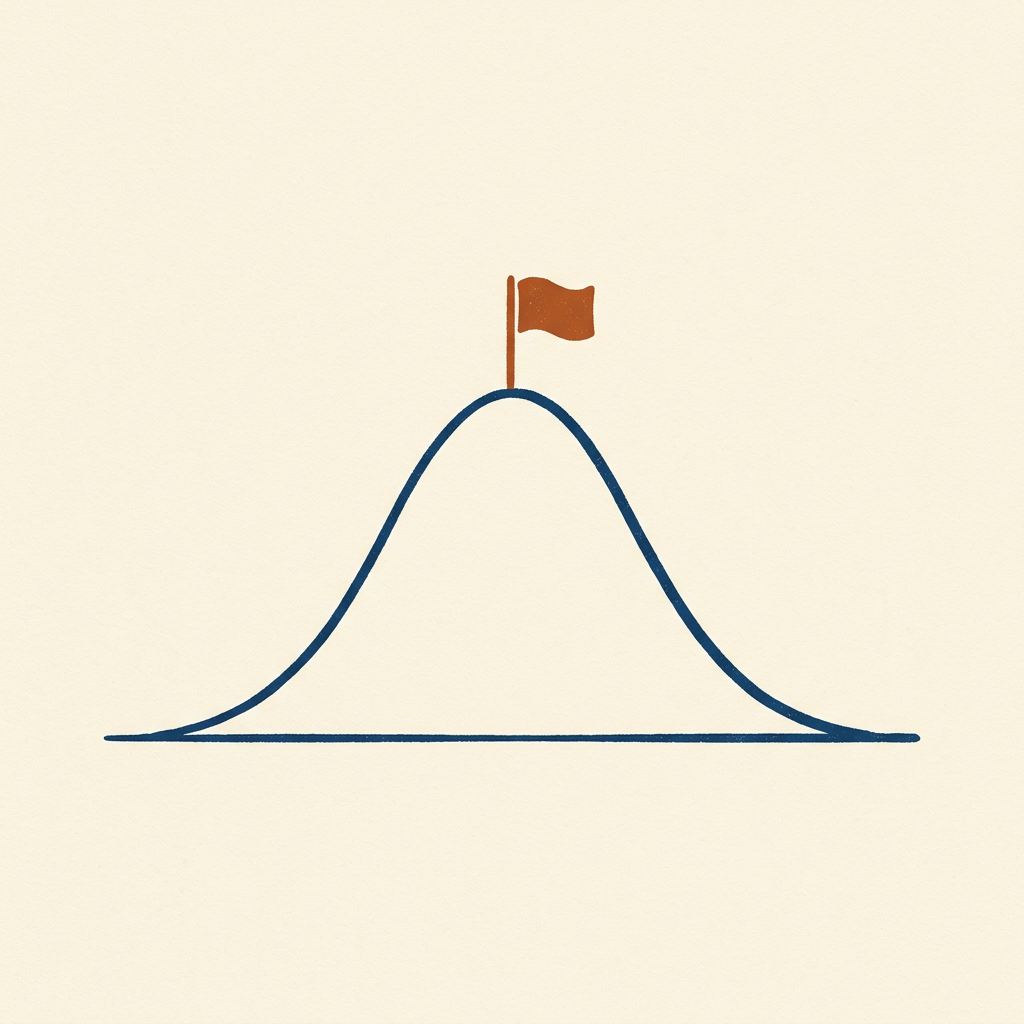
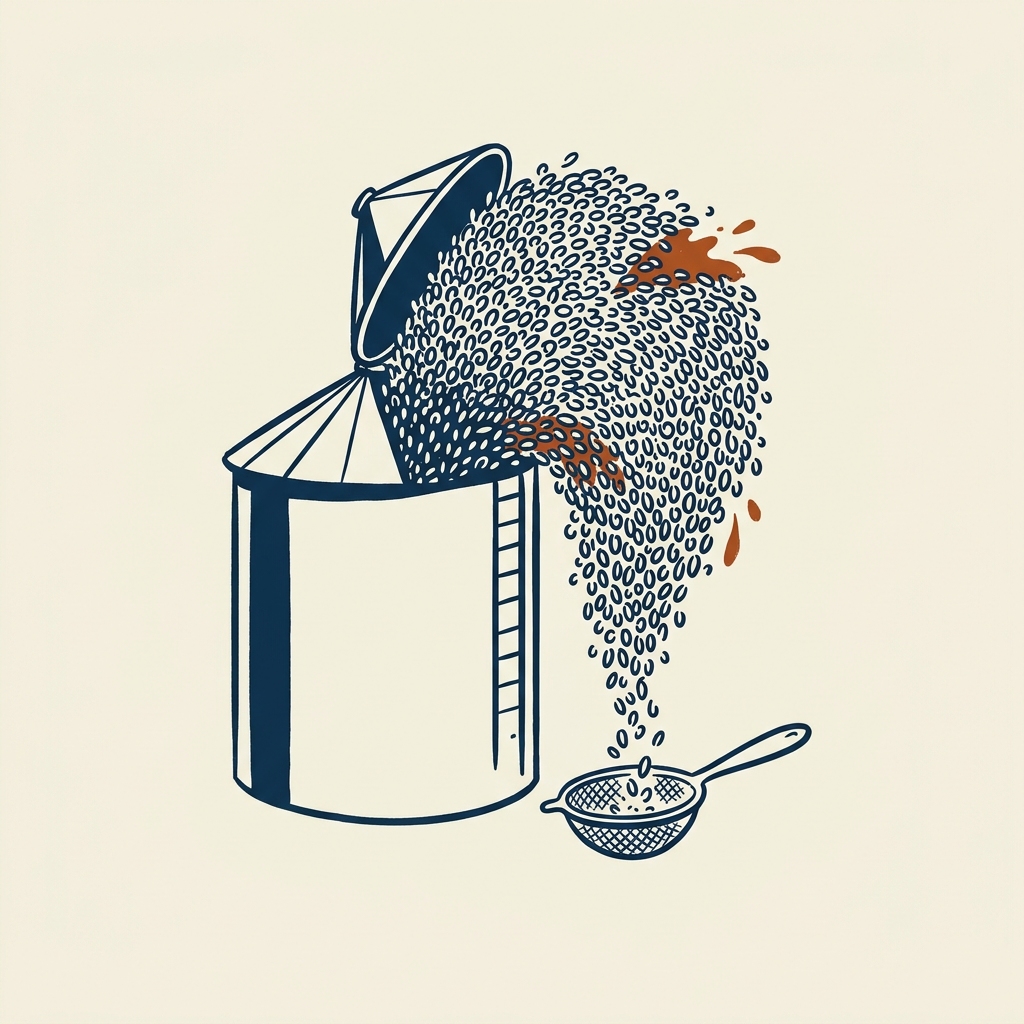
Later chapters turn to credit scoring, search algorithms, and massive administrative files. Scale changes; the underlying failure modes do not. Bias, false patterns, and the leap from association to cause survive and can worsen when tables stretch into millions of rows.
Volume cannot replace a sound model. An early project that inferred flu from search queries looked strong at first, then badly overestimated prevalence once it began tracking media-driven searching instead of illness itself.
Data mining multiplies the old multiple-comparisons problem. Enough variables and enough computer passes guarantee accidental correlations; pattern is cheap when noise is infinite.
The earlier toolkit—distributions, intervals, the gap between significance and importance—matters more, not less, under data abundance, because the temptation to mistake noise for meaning grows with the pile.
In practice: Google Flu Trends first impressed, then significantly overestimated flu because it was capturing media-driven searches rather than actual illness.
9
Presentation as persuasion
The same true data can be framed to support opposite conclusions, so statistical literacy is a civic and ethical duty, not only a technical skill.
Relative framing
“Doubles the risk” sounds dramatic and urgent
Absolute framing
One in a million becoming two in a million stays tiny
Wheelan closes by moving from method to display. Honest arithmetic still misleads when the frame is selective: a truncated axis exaggerates a small shift, a convenient time window invents a crisis or erases a real trend, and relative risk language inflates a tiny absolute change.
Earlier objects—income averages, poll margins, regression coefficients—return as rhetorical weapons that remain technically correct while steering the audience. Statistics is unusually open to this honest deception because most readers cannot recheck the underlying work the way they might challenge a plain verbal claim.
That is why he casts literacy as democratic equipment. Voters meet policy numbers, juries meet probabilistic evidence, consumers meet risk copy. The defense is the habit of asking what the sample was, what was left out, and what baseline sits under a dramatic comparison.
Every prior tool exists not only to produce answers but to let ordinary people hold other people's answers to account.
In practice: A treatment can be described as doubling risk when the absolute change only moves from one in a million to two in a million.
Key terms
- description Compressing a mass of data into a few comprehensible summary numbers
- inference Using a sample to make a reliable claim about a larger population you cannot fully measure
- standard deviation A measure of how spread out values are around the mean
- conditional probability The chance of one event given that another event has already occurred
- central limit theorem Sample averages tend toward a normal shape as sample size grows, even when raw data are messy
- confidence interval A range, tied to a confidence level, that communicates sampling uncertainty around a result
- null hypothesis The default claim that there is no real effect, which a test tries to reject
- p-value The probability of seeing a result at least this extreme if the null hypothesis were true
- omitted variable bias Distortion that appears when a real driver is left out of a regression model
- margin of error The sampling-uncertainty band around a poll or estimate; silent about bad questions or bad samples
What to do
- Ask what the sample was and whether it could be skewed before accepting any headline number.
- Check whether a reported average is the mean and what the distribution or median would show instead.
- List one alternative explanation—confounder or reverse cause—before treating a correlation as proof.
- Apply the three-question checklist to one work metric this week before repeating it in a meeting.
- When a risk is called a “doubling,” translate it back to absolute baseline numbers.
Questions to think with
- Which everyday number I trust at work is really an average hiding a skewed distribution?
- When I last saw a “significant” study, did anyone separate statistical significance from practical size?
- What variable is probably missing from the last regression-style claim I accepted?
- How would this poll or dashboard change if the sample excluded people like the Literary Digest misses?
- Where do I currently treat a graph’s framing as neutral rather than as a rhetorical choice?
The other side
The book is a strong conceptual on-ramp but skips most formulas, so readers still cannot run a regression or proper test without another course; it predates the replication-crisis and p-hacking debates that intensified after 2013, leans on American examples, sometimes oversimplifies fights over observational versus experimental evidence, and never introduces Bayesian inference as a rival framework.
Who it's for
Students who passed statistics without understanding it, professionals who must judge data-driven reports, and curious readers who want to see how polls, trials, and analytics actually work—and fail—will get the most from reading the full book.