




Numbers only answer the questions they were built to answer
Anyone who meets risk figures, study claims, or algorithmic scores gets a working skepticism from The Art of Statistics.
IJR · Nov 6, 2026 · 11 min read
In 60 seconds
- Statistics is the PPDAC cycle—problem, plan, data, analysis, conclusion—and framing the problem first matters more than any technique.
- Means and medians erase distribution shape; aggregation is a choice that can reverse real subgroup trends.
- A correlation supports causation only after checks like strength, consistency, timing, mechanism, and dose-response.
- Long-run frequency and degree-of-belief probability are different tools; a p-value only scores surprise if nothing is going on.
- Algorithms tuned purely to predict can score well with no causal insight and can amplify bias in their training data.
- Relative risk without an absolute baseline turns tiny absolute changes into public scares.
The big idea
The Art of Statistics treats statistical literacy as disciplined skepticism about where a number came from, what question it answers, and what it leaves out. Spiegelhalter's claim is that every stage from framing to communication can admit honesty or distortion, so impressive form never substitutes for a well-posed problem.
The book in brief
Harold Shipman's patients died at unusual hours at rates no comparable GP matched. Statisticians noticed because they asked whether the pattern fit natural causes—before any clever test.
Spiegelhalter rejects the image of statistics as formulas you run once data arrives. He walks a full arc: how to pose a problem, how summaries and correlations mislead, how probability and significance get misread, how courts and algorithms fail people, and how risk is worded to the public.
Early chapters show a single average can hide opposite distributions, and pooling groups can reverse every subgroup's trend. Causal talk needs more than a strong association; it needs a structured case. Probability itself splits into long-run frequency and degree of belief, and public fights often mix the two.
Mid-book he turns to science's own habits—significance thresholds treated as proof—and to criminal trials where a striking rarity is mistaken for guilt. Then come machine-learning tools that forecast without explaining, trained on histories that already embed bias.
He lands on the last mile: medical risk wording. Relative frames that double a tiny baseline drove a contraceptive scare. Screening debates, he shows, boast prevented deaths while soft-pedaling overdiagnosis and treatment people never needed.
Context
David Spiegelhalter published the book in 2019 for general readers as fights over data, algorithms, and misinformation were heating up, offering tools to question numbers rather than swallow or reject them on instinct. Its cases lean British—the NHS, Shipman, Sally Clark, Brexit—which sharpened some examples and felt local to readers elsewhere.
The key ideas

1
Ask the problem first
The PPDAC cycle—Problem, Plan, Data, Analysis, Conclusion—beats any technique; analysis without a real problem answers nobody's question.
Spiegelhalter throws out the image of statistics as calculations you run once data shows up. He offers the PPDAC cycle instead. Order is the point. Jump straight to analysis and you get tidy numbers for a question no one posed.
Harold Shipman, the English GP later convicted of murdering patients, makes the stakes plain. Reviewers of mortality data saw deaths clustered at odd times of day and rates far above comparable doctors. No exotic test found him. The work started by asking whether the pattern fit natural causes.
That habit—what problem am I actually solving—runs through every later topic. Correlation, significance, and algorithms all circle back to whether the question was clean before anyone trusted the output. Literacy here is skepticism about origin, purpose, and what would count against the claim.
Polished analysis aimed at the wrong problem does more harm than leaving the data alone.
In practice: Shipman's excess deaths at odd hours surfaced because statisticians framed natural-causes-versus-not before touching the file.

2
What one number hides
The same mean can come from a bell curve or a long tail; aggregation can reverse every subgroup pattern.
Headline mean
One average reported as the whole story
Full distribution
Shape, spread, and subgroups kept visible
The next trap is the summary itself. A mean or median can spring from wildly different shapes. A symmetric mound and a skewed pile with a long tail can share one average and tell opposite stories.
Income data shows how. Countrywide average income can climb while most people earn less, if a few very high earners drag the mean up. Reports of the average with no spread mislead even when every digit is correct. Histograms and dot plots beat headline single figures.
Simpson's paradox drives the point home: a trend in combined data flips when you split into groups. University admissions once seemed to show women admitted at lower rates overall, yet equal or higher rates inside nearly every department, because women applied more to the tougher ones.
Aggregation is a choice. The level you pick can invent a conclusion the fine grain never held.
In practice: Women looked less likely to win admission in the aggregate while matching or beating men inside nearly every department, because they applied harder to competitive ones.

3
Causation needs a case
A correlation becomes causal evidence only after independent checks—not through statistical strength alone.
Public life abuses the leap from association to cause. Spiegelhalter revives Austin Bradford Hill's checklist, built to weigh whether smoking caused lung cancer: strength of association, consistency across studies, specificity, temporal sequence, a plausible mechanism, and dose-response.
No single item proves cause. Together they can justify action—as they did for smoking long before a definitive randomized trial was possible or ethical. Trials remain the gold standard because random assignment breaks ties to confounders. Most questions in medicine, economics, and policy still cannot wait on trials alone.
Spurious pairings make the opposite point. National chocolate consumption lines up with Nobel prizes per capita; wealth almost certainly sits underneath both. A coefficient is a start for investigation, not a verdict.
Later chapters lean on this stance: a strong statistical link invites work, it does not close the case.
In practice: Chocolate-eating nations racking up Nobels looks like a link until wealth is seen as the common driver of both.

4
Probability's split meanings
Confusion about risk often comes from mixing long-run frequency with degree of belief about one unrepeatable case.
Frequentist
Long-run share of repeated trials
Subjective
Degree of belief about one case
Frequentist probability tracks long-run frequency across repeated trials—how often a fair coin lands heads over many flips. Subjective or Bayesian probability tracks degree of belief about a single event: this defendant's guilt, this patient's response to treatment.
Weather forecasters, insurers, and gamblers live in the frequentist habit fairly well. Courts, doctors, and voters get pushed into the subjective sense, where no long run exists. One version is not crowned correct. Clarity about which is in play is the discipline public talk usually skips.
The 2016 Brexit referendum and US election forecasts looked 'wrong' to many when the less likely outcome won. A well-calibrated forecast that gave an outcome twenty or thirty percent is not falsified when that outcome occurs.
This split sets up courtroom Bayesian use later. Importing frequentist instincts into unique cases produces some of the costliest statistical errors institutions make.
In practice: A forecast giving an outcome a twenty or thirty percent chance is not broken simply because that outcome happens once.
5
The narrow p-value
A p-value scores how surprising data would be if there were no effect—not the probability the hypothesis is true.
What p answers
How surprising is the data if there is no effect?
What people hear
Proof the hypothesis is true or the effect matters
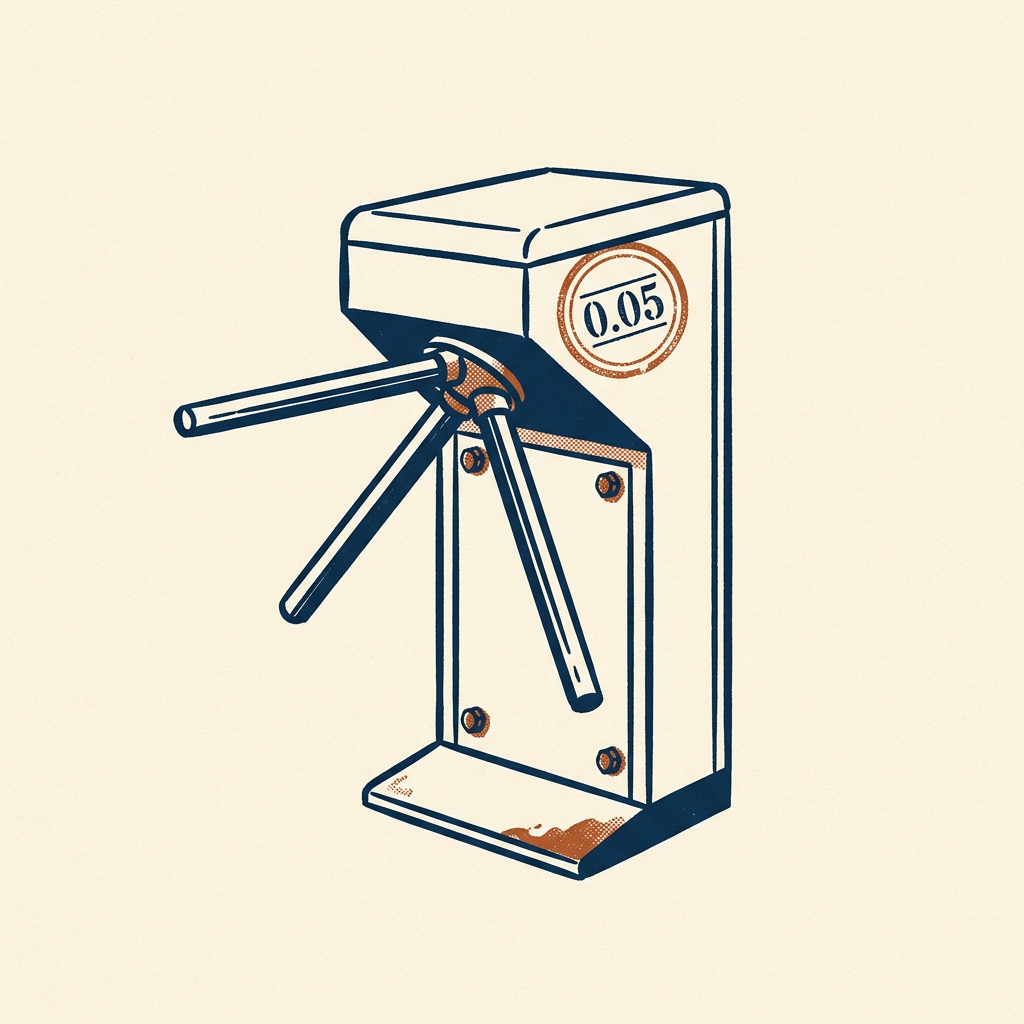
Researchers lean on significance testing as a referee. A p-value answers one technical question: how odd is this data if nothing real is going on. It does not give the chance your hypothesis is correct. It does not give effect size or importance.
Treating a cross of the conventional 0.05 line as proof, and anything above as nothing, helped produce what much of science now calls a replication crisis. Many psychology studies failed when independently repeated. P-hacking—running analyses until one clears the line by chance, then reporting only that one—became a named habit.
The tool is not thrown out. It needs pairing with effect size, design quality, and prior plausibility. Confidence intervals and full spreads of possible effects beat a pass/fail stamp.
Even a study strong enough for a causal claim can still mislead if journals and journalists overread what a p-value allows them to say.
In practice: Psychology's wave of failed replications followed years of treating a 0.05 threshold as a truth switch.

6
Base rates in court
Juries convict on rare-event figures while skipping how rare the guilt hypothesis is too—the prosecutor's fallacy.
Criminal courts raise the stakes. Sally Clark, a British solicitor, was wrongly convicted in 1999 of murdering her two infant sons. An expert said the chance of two natural cot deaths in one family was about 1 in 73 million, from squaring the single-death probability.
That math was wrong on its own terms: it treated the deaths as independent when shared genes or environment could make a second cot death more likely. The deeper error was the prosecutor's fallacy. Even a correct tiny chance is not impossibility. The jury had to weigh that rarity against the also-rare alternative that a mother killed both children.
Clark's conviction was overturned in 2003 once the flawed statistic was exposed. Bayesian updating—revising a prior in light of evidence—asks which story, murder or natural death, fits the combined facts better, rather than how shocking the coincidence looks alone.
Literacy for judges, jurors, and experts is a safeguard against wrongful conviction, not a classroom ornament.
In practice: The 1-in-73-million cot-death figure helped convict Sally Clark until the fallacy and the independence error were exposed and the verdict quashed.

7
Accurate without understanding
Models trained only to predict can score well with no causal mechanism, then lock in biased history when used on people.
Prediction
High accuracy from historical patterns alone
Explanation
A causal account you can justify and correct
Machine learning now drives decisions in medicine, lending, and criminal justice. Prediction is not explanation. A model can forecast who defaults, reoffends, or responds to treatment from historical patterns without any piece standing for a cause.
Deploy that model on individuals and the cracks show. Biased training data gets reproduced and often amplified. A black-box score may flag someone as high risk with no usable account of why, so the person cannot contest the reasoning. Race-correlated variables can seep in even when race itself is barred.
Algorithmic prediction is not scrapped. Real gains show up in places like medical imaging. Predictive power still needs scrutiny of training data, ongoing error audits, and a clear line between a tool that aids a clinician and one that replaces judgment.
An algorithm's link to an outcome is not evidence it understands that outcome. Institutions that blur the line hand decisions to a process no one can interrogate.
In practice: Risk tools in UK and US justice can absorb race-correlated signals indirectly and leave defendants no way to challenge the model's path.
8
Absolute risk or drama
Relative risk can double a tiny baseline and sound like a crisis; absolute figures and natural frequencies keep the scale honest.
Relative only
Risk doubled—sounds like a crisis
Absolute beside it
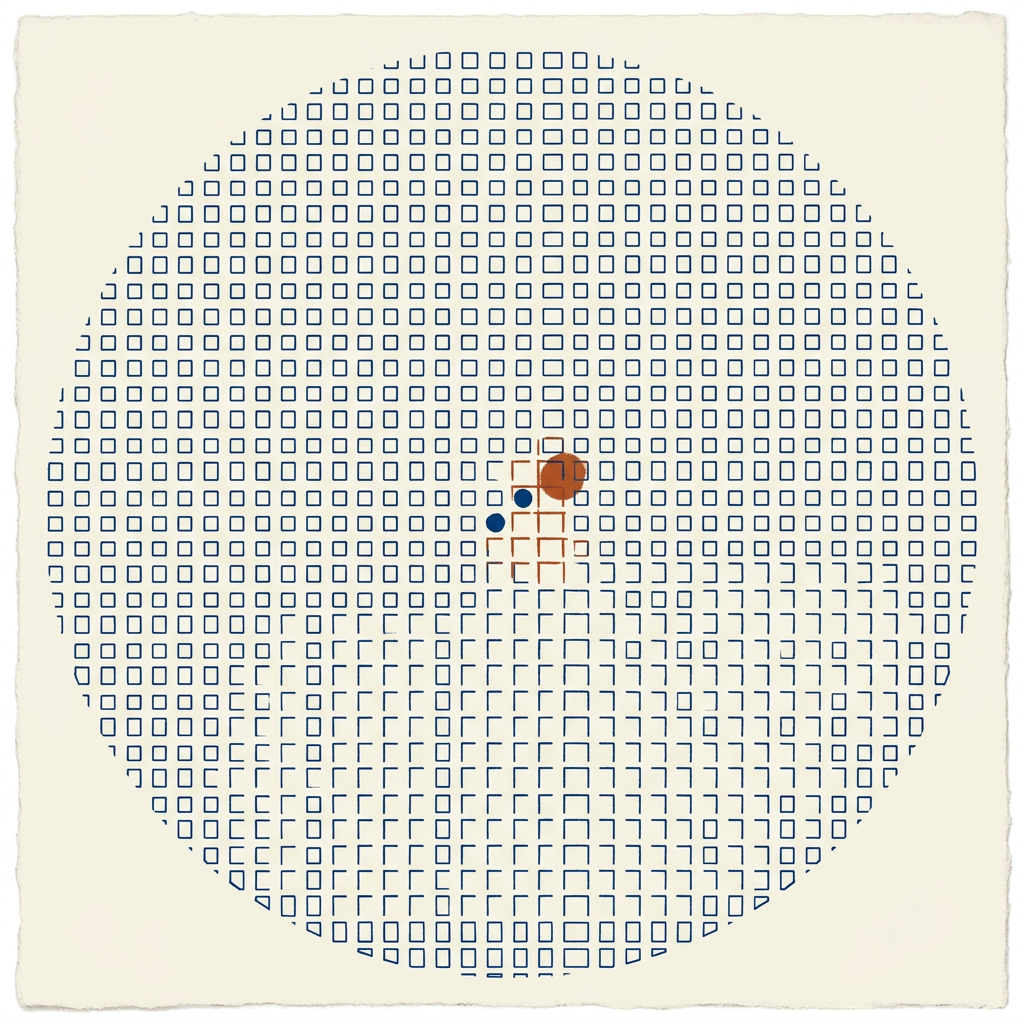
From ~1 in 7,000 to 2 in 7,000 women per year
Risk talk is where statistics meets the public hardest. In 1995 UK regulators said a newer contraceptive pill doubled blood-clot risk. True as a relative claim. Absolute risk moved from roughly 1 in 7,000 to 2 in 7,000 women per year.
Reported without the baseline, the doubling set off panic. Women quit the pill in waves. Unwanted pregnancies and abortions rose afterward. Relative figures get chosen, often without bad intent, because they sound larger. Absolute risks belong beside every relative comparison.
Natural frequencies such as '2 out of 7,000' beat percentages for intuitive grasp. The same demand reaches breast cancer screening: benefits in deaths prevented get overstated when overdiagnosis and unneeded treatment stay offstage.
Good risk communication is honesty about uncertainty—what is known, what is estimated, and how firm the estimate is. A clean question and careful analysis still fail if the closing translation misleads the people it was for.
In practice: The pill scare's relative 'double' hid a shift from about 1 in 7,000 to 2 in 7,000 and helped drive a rise in unwanted pregnancies.
Key terms
- PPDAC cycle Problem, Plan, Data, Analysis, Conclusion—the inquiry loop that should lead the work
- Simpson's paradox A pattern in combined data that flips when the data is split into groups
- Bradford Hill criteria A checklist for judging when an association supports a causal claim
- Frequentist probability Chance as long-run frequency in repeatable trials
- Subjective probability Degree of belief about a single unrepeatable case
- p-value How surprising the data would be if there were truly no effect
- Prosecutor's fallacy Treating the rarity of evidence under innocence as the chance of innocence
- Absolute risk The actual chance of an outcome, not just how much it multiplied
- Natural frequencies Counts like 2 out of 7,000 instead of bare percentages
What to do
- When a statistic startles you, ask what original question it answered and whether that is the question now implied.
- Check whether a risk figure is relative or absolute and name the baseline it compares against.
- Before treating a correlation as causal, list what mechanism, consistency, and timing evidence would be needed.
- When you present a risk, state absolute natural frequencies and say how confident the estimate is.
- If a work decision rests on a predictive model, ask what data it learned from and demand error rates broken down by affected group.
Questions to think with
- What question was this number originally built to answer?
- If this risk doubled, what were the absolute counts before and after?
- What would count as evidence against the conclusion being drawn?
- Is this probability a long-run frequency or a belief about one case?
- Does this algorithm's accuracy come with any account of why it flagged this person?
The other side
It is a survey, not a training manual: concepts without enough math to run the analyses on new data. Cases lean British and may feel parochial elsewhere. Published in 2019, it misses COVID-era tests of public literacy. It is gentle toward the profession and institutions, underplays power and incentive capture, and treats algorithmic bias only briefly.
Who it's for
Curious readers who distrust news statistics, early-career analysts who know formulas but not judgment calls, and health or policy professionals who must explain risk will get the most; the book sharpens skepticism rather than replacing a methods course.